I haven’t posted any graphs since The Gratuitous Graphs of February and said then that I wouldn’t post any more until the end of May. Incredibly, I managed to resist even then, but with the first half of the year having passed I thought it was time to see how things are progressing against this year’s target. Here’s how the year’s going so far:
The Miles per Month chart is looking quite healthy so far. The second half of the year never looks so good, and I anticipate that things will drop of sharply in July and August as a couple of things are going to hamper my walking activities:
The next one isn’t really relevant as I don’t have any ascent based targets and have never compared my ascent figures year-on-year, but I thought I’d include the graph anyway:
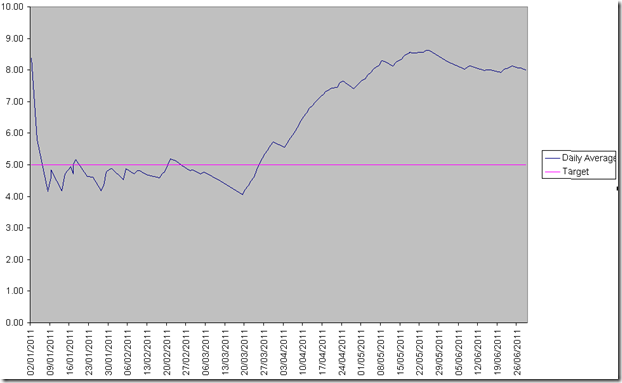
My target for the year is to average 5 miles per day. There will now be a sharp drop off back down towards the pink line, but with only 380ish miles left to walk over the next six months it looks to be achievable:
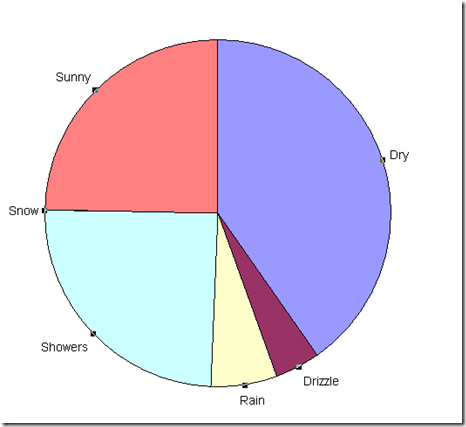
Considering that we generally had such fantastic weather for the East to West Walk, it’s surprising that wet weather (whether rain, showers or drizzle) takes up such a large part of the weather pie chart (but I suppose that it has rained on almost every walk I’ve taken since 9th May!):


Wow, not one graph but four. Value for money that :-)
ReplyDeleteLoving the pie Chart :) Somehow i now know why you are an Excel wizard :) Maike
ReplyDelete